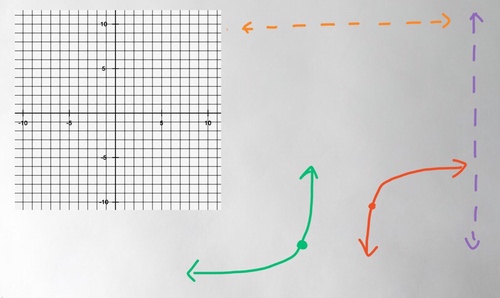
SM3 U3R3 Identify Transformations

In detail, describe to a very ditsy Lone Peak girl how to graph the following equation.
Fill in each box with the LETTER that best describes it (from the choices given on the right side of this table)
|
|
The scale factor for this equation was (number).
To plot the control points (the dots on the green and red curves) I would
place my pencil
and then go
as well as
This means the red curve should be drawn in the region of my graph
and the green curve should be drawn in the region of my graph.
Graph and Check all the transformations that apply.

Graph and Check all the transformations that apply.
